First of all a frank admission.
Even though Nifty moved up to achieve the targets, it is more difficult now to predict the form of move since nifty started moving up from 2300 than it was easier in the previous waves.
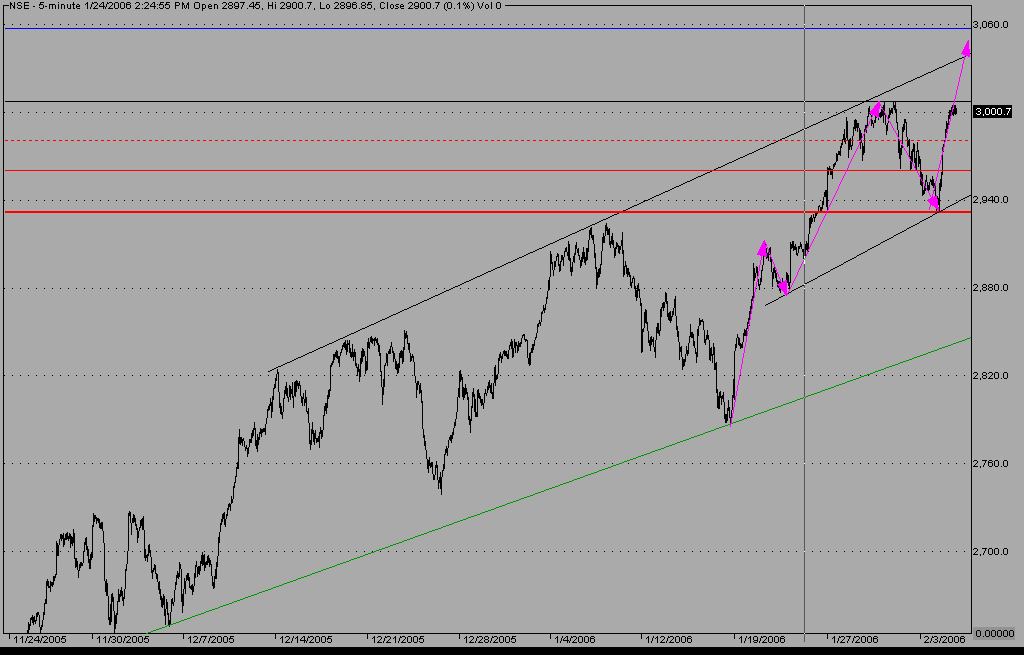
If Nifty keeps moving the next imp stop is 3080-85 region and crossing it it comes to 3160-65 area. (3160 is the fathest I can see it going before a serious corerction sets in). If it goes more than 3160 please send some bricks to me. :-)
The stop loss for this bull case is 3020 and a deeper stop is 3000.
While the Nifty 50 and Sensex30 is moving up the other indexes which have a large num of stocks in them donot look equally strong. (this call for caution to longer term investor. I have sounded this alram since many days that the this and coming days should be used to offload stocks and not to accumulate) The Nifty500 index is much weak and can expect more dips in it.
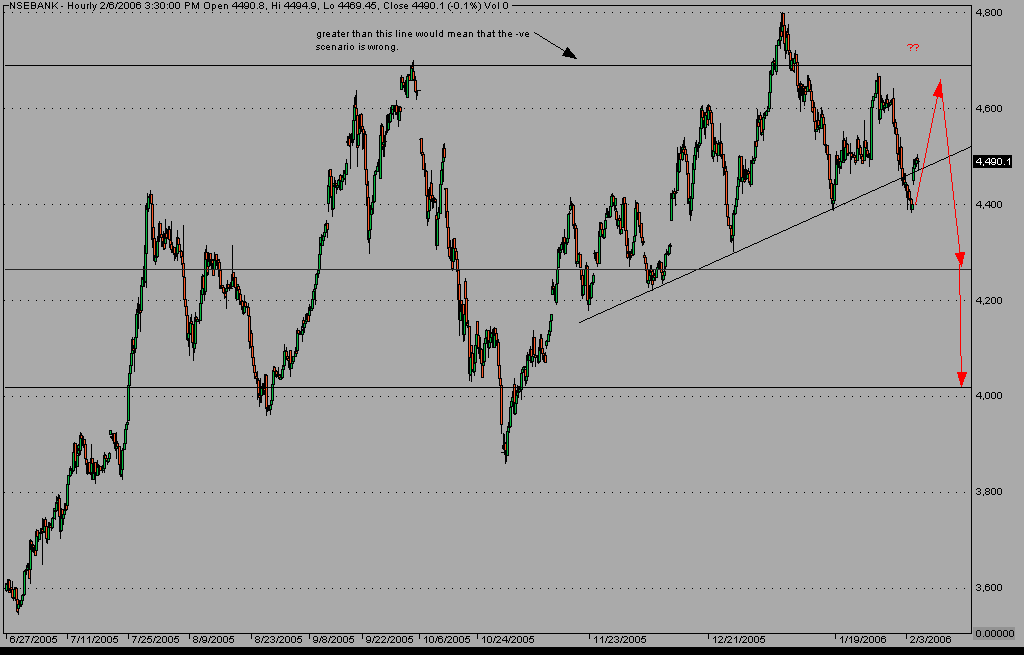
bankindex on which i had posted a bear view rose and fell again very much in accordance with the image. (look here)
The days of stocks moving up and down in rhythm is gone past and now we have some stocks soaring while others sink. This is what happens in later stages of a mature market where only a few stocks make new highs while others keep falling.
For the -ve case NSE falling under 3000 would destory the +ve case and open up the gates to deeper correction.
Use this simple Inputs in ur trading. (as always there is not yes or no answer, we can only discus cases)
Have a view, do leave a comment.
=========
To Use Live data for your trading.
Use EagleEye Trading.
Visit here to know more.
Thursday, February 23, 2006
>Why Trade using Channels
I LOVE CHANNELS. lets see why..
Stocks are like race cars which move on race tracks. Divide the race track into 3 or 4 parallel tracks. Stocks tend to hit one end of this race track and then move to the other end. (not kidding) Stocks Tend to get out the channels if they had remained inside it for very long.
A small article from Investopedia Channeling: Charting A Path To Success
Channels change over time.
A stock which moves up a steep channel would not remain forever in rising mode.
It would some day crack the lower lane of the channel and make a fall or go sideways.
How the stock falls could make flags patterns which are again channels. Some times stocks when consolidation or correcting would make triangles, which is a converging channel.
Always make channels with 3 lines. Upper line, Middle LIne and central line.
when a stock kisses the upper line and fall under the middle line.. we can short assuming that the stock would touch the Lower Line of the Channel.
When a stock kisses the lower channel and moves up through the middle channel again we can get long assuming the stock would tend to kiss the Upper channel.
The middle channel gives a guiding idea on, where the stock is compared to the extremes and is very useful in trailing positions. For example if some one is long and the stock remains on top of middle channel he should let the position run.
Channel trading gets more power when you add ideas from
Elliott Wave
Ratracement and Extensions
and some Time Cycles into it.
More on this additional ideas later on. Got a view? Do post ur comment.
============================================
Ever used Live data to trade real time channels?
Try EagleEye Trading?
Visit http://finance.groups.yahoo.com/group/EagleEyeTrading
Stocks are like race cars which move on race tracks. Divide the race track into 3 or 4 parallel tracks. Stocks tend to hit one end of this race track and then move to the other end. (not kidding) Stocks Tend to get out the channels if they had remained inside it for very long.
A small article from Investopedia Channeling: Charting A Path To Success
Channels change over time.
A stock which moves up a steep channel would not remain forever in rising mode.
It would some day crack the lower lane of the channel and make a fall or go sideways.
How the stock falls could make flags patterns which are again channels. Some times stocks when consolidation or correcting would make triangles, which is a converging channel.
Always make channels with 3 lines. Upper line, Middle LIne and central line.
when a stock kisses the upper line and fall under the middle line.. we can short assuming that the stock would touch the Lower Line of the Channel.
When a stock kisses the lower channel and moves up through the middle channel again we can get long assuming the stock would tend to kiss the Upper channel.
The middle channel gives a guiding idea on, where the stock is compared to the extremes and is very useful in trailing positions. For example if some one is long and the stock remains on top of middle channel he should let the position run.
Channel trading gets more power when you add ideas from
Elliott Wave
Ratracement and Extensions
and some Time Cycles into it.
More on this additional ideas later on. Got a view? Do post ur comment.
============================================
Ever used Live data to trade real time channels?
Try EagleEye Trading?
Visit http://finance.groups.yahoo
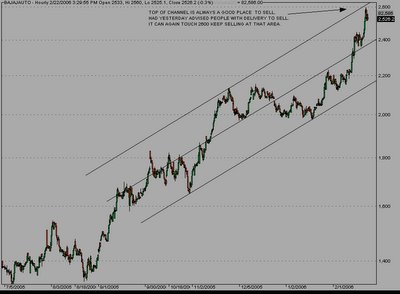
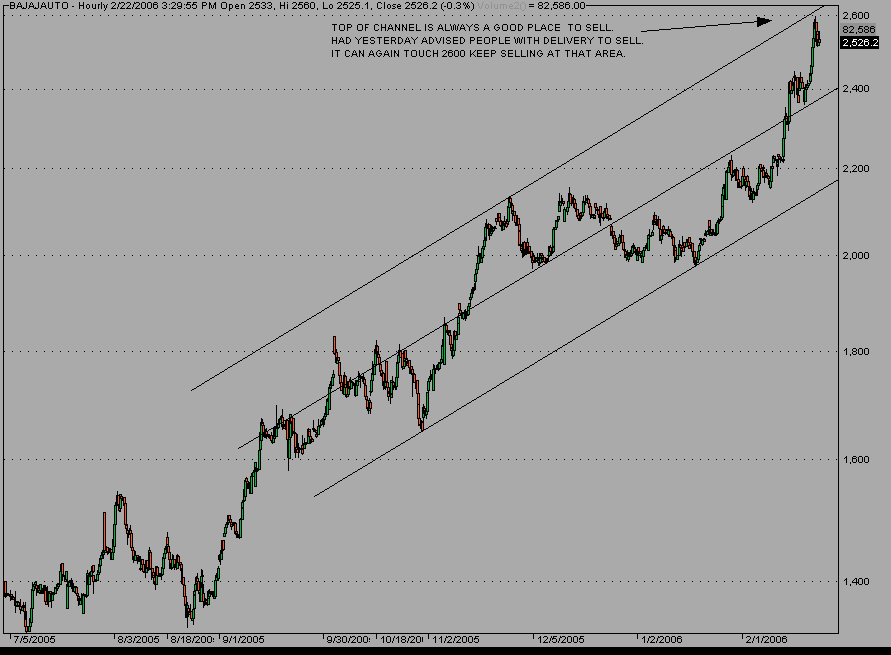
>Why BAJAJ-AUTO is a SELL now.
Open image in new window and read.
The stock rose to touch the upper channel and was a sell at 2600.
Those not yet sold should use the next rise to 2600 region to sell.
Pick again when it falls to 2000-2200 area.
============================================
Ever Tried EagleEye Trading?
Visit http://finance.groups.yahoo.com/group/EagleEyeTrading
The stock rose to touch the upper channel and was a sell at 2600.
Those not yet sold should use the next rise to 2600 region to sell.
Pick again when it falls to 2000-2200 area.
============================================
Ever Tried EagleEye Trading?
Visit http://finance.groups.yahoo
>Tata Steel Price and Steel Price Corelation

Enjoy the chart.! (open in new window)
every stock price high low node is same in steel and tata steel price.!
=>the tops and lows in steel were made slightly earlier than that in tata steel..
and this some trading advatnage? ;-)
sugar prices and sugar stocks are no different..!!
Are you a hardcore trader?
Tried EagleEye Trading?
Tried EagleEye Trading?
Wednesday, February 15, 2006
>Nifty 15-02-2006
Are yor EagleEye'd? Find out here..>
A little dense image..
Open image in new window (zoom if needed) and read slow.
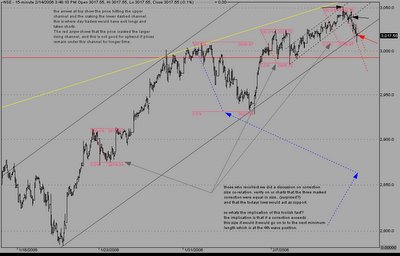
first for the applause...! Today morning we did 3051.5 (missed target of 3055 !!)
In the image you can see the small channeling action as well as the larger channels and how they cracked.
ok all that is history lets look ahead..
We cracked the larger channel in last 30 mins of trading.
If nifty remains under this channel for longer we got a larger dip coming.
Also note that the rise form 3000 to 3050 was much slower than previous upmoves.
This points to 2 facts.
1=>Either we are seeing a terminal in 5th wave which started 2785
2=>or this upmove to 3050 was some complex correction and much more upmove is pending.
2 would get ruled out if tomorrow nifty cracks 2990-80 and then we would see a much larger dip then.
The other option is that tomorrow we rise again to reach close to the highs and then make a final deeper sell off.
Use channels and % retracement to determine. The caution alarm is already ringing..!
Safe guard your investment.
In earlier posts had commented that CNXIT and NSEBANK are weak. Today we saw CNXIT making a large fall and can expect more red from NSEBANK in coming days.
Monday, February 13, 2006

>Nifty 13-02-2006
post on >Nifty 19-01-2006 go long at 2875 area...
latest post yesterday.. >Nifty 12-02-2006 stop loss advised at 2980
2875 to 3035 now... = 160 pts
aggressive stop loss now at 3020
3025 was a good resistance with nifty kissing it 4 times earlier to crossing.
we keep our stop loss 5 pts under it.
A larger more acomodative stop loss is at 2980 which is same as that in earlier posts.
One can even take some profit if 3020 is cracked and get long again at 2980 lows with again a 10 pts stop.
note: the analysis in this log is only for spot prices and not for futures. (unless explicitly stated)
Sunday, February 12, 2006
>Nifty 12-02-2006
Most things remains same as earlier posts.
Targets remain the same. To read previous post refer this links.
>Nifty 06-02-2006
>NSE Long and Near Term Channels and Targets
>NSE 27-01-2006
Now Stop loss raised to 2980 or 2990.
This regular raising of stop loss as mkt moves is what locks in the profits. Just rise with the trend..
In AIII group check this post. Have sent charts of channels of many stocks.
channels of many stocks..
Channels are great stuff. a few more points..
Did you try EagleEye till now?
EagleEye is a simple tool for get Live data price volume in Ami. ( would soon get extened to other tools and date sources)
Its works great and the data speed is amazing.
Please read this links and download the attachments.
Setup the tools as shown in the documensts you downloaded from groups.
earlier to market open, Login into yahoo.finance.com or in your yahoo mails.
Start EE and add wings to your trading with live data.
Download from here a demo copy of EE... Read the documets in the zip file to get more ideas.
Download a Ami Data System which is fully loaded with a ton of historical intraday data. here...
for Amibroker visit www.amibroker.com its a great tool for trading.
Targets remain the same. To read previous post refer this links.
>Nifty 06-02-2006
>NSE Long and Near Term Channels and Targets
>NSE 27-01-2006
Now Stop loss raised to 2980 or 2990.
This regular raising of stop loss as mkt moves is what locks in the profits. Just rise with the trend..
In AIII group check this post. Have sent charts of channels of many stocks.
channels of many stocks..
Channels are great stuff. a few more points..
- Stocks tend to move from one channel to another.
- A crack of channel line to up-side takes us to next higher channel.
- and a crack on downside takes us to the lower trend channel.
- A crack of even the lower trend channel means that the trend is reversing. (if it was up)
- A crack of upper trend channel on upside on log scale means the trend is very powerful and can expect more moves. (in case this was not the last upthrust, speaking elliott wise)
- Not a good things.
- Gold and Oil can shoot up and so would general commodities.
- Rising commodity prices would -ve impact earning.
- Also the harsh action of US to uni-laterally show aggression would have -ve impact on dollars and a sliding dollar would inpact Indias/Asias export led companies.
- Importing companies would find their profits rising.
Did you try EagleEye till now?
EagleEye is a simple tool for get Live data price volume in Ami. ( would soon get extened to other tools and date sources)
Its works great and the data speed is amazing.
Please read this links and download the attachments.
Setup the tools as shown in the documensts you downloaded from groups.
earlier to market open, Login into yahoo.finance.com or in your yahoo mails.
Start EE and add wings to your trading with live data.
Download from here a demo copy of EE... Read the documets in the zip file to get more ideas.
Download a Ami Data System which is fully loaded with a ton of historical intraday data. here...
for Amibroker visit www.amibroker.com its a great tool for trading.
Monday, February 06, 2006
>Nifty 06-02-2006
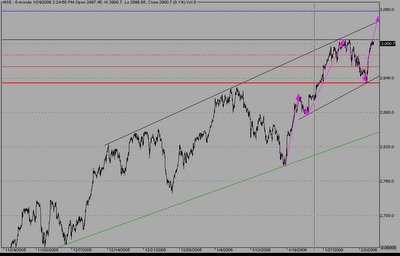
A recap from previous post made on >NSE 27-01-2006 we had a wave count of 123 from 2785 in NSE and were waiting for either wave 3 do 1.6 times of Wave 1 or wave 4 to start. We got a wave 4 correction down to 2930 in NSE. This was deeper than expected, even then it didnot retrace more than 62% of wave 3 leaving the uptrend intact. Sensex retraced lesser than Nifty and this is effect of more weight of ongc in NSE which had corrected in last few days.
Todays move was unexpectedly fast even during the initial waves of the new upmove. Though the uptrend was in mind the speed was furious in morning and that too after the opening dump.
In th previous post we had made 3 red lines. (dotted at 2960 , plain at 2930 and deep red at 2915)
The lines have same meaning as usual. To repeat once again.
Looking ahead.=>
Targets measured from 4th wave low were
3005-3010. this was achieved today itself.
Next comes 3055-3060.
More targets can open up. Would ponder on that when we have reached 3060 zone.
Stop loss as shown in Plain red line is placed at 2960.
We would move this up when nifty moves greater than 3010 and place it at the dotted red line.
We should move stop loss up as we move up.
additional notes.
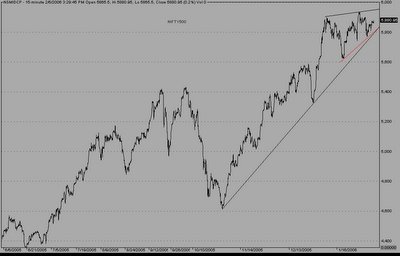
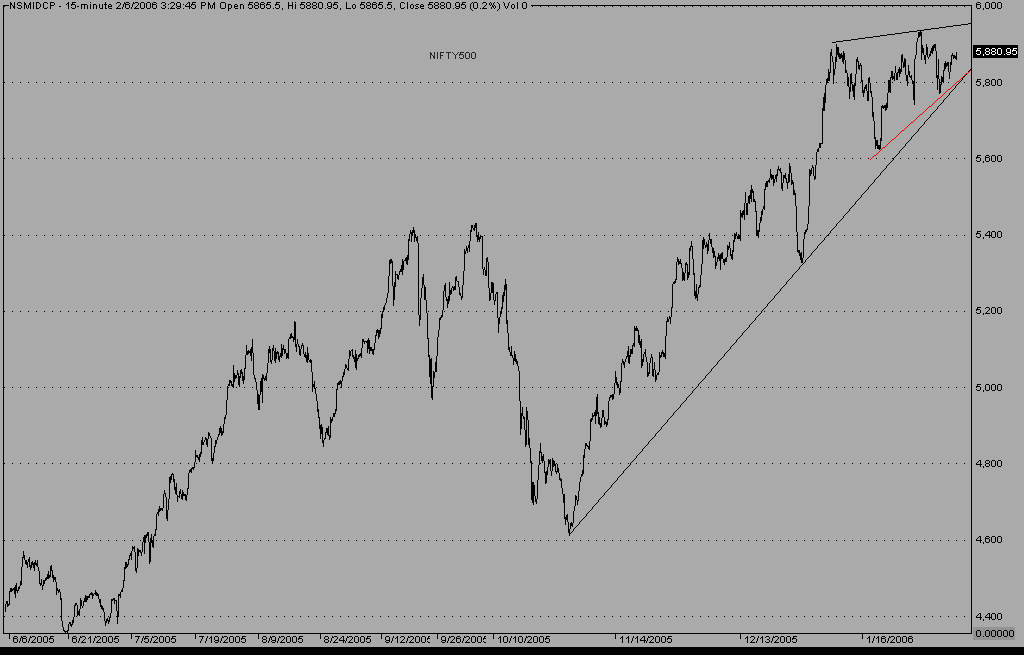
Nifty 500 doesnot shows the same power as Nifty50. Many a times nifty500 lags nifty50.
Even then watch the red line in nifty 500 charts and cracking under it would mean -ve changes.
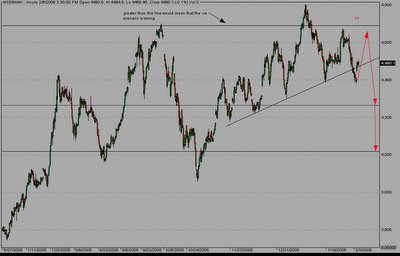
In longer time frames I am Bearish on NSEBank and CNIT.
I go wrong if CNIT makes new highs and remains there for 1-2 days.
Image for NSEBank is pasted under.
Todays move was unexpectedly fast even during the initial waves of the new upmove. Though the uptrend was in mind the speed was furious in morning and that too after the opening dump.
In th previous post we had made 3 red lines. (dotted at 2960 , plain at 2930 and deep red at 2915)
The lines have same meaning as usual. To repeat once again.
- Remaining greater than Dotted means trend is safe. Nothing to think of.
- Getting lower than Dotted and greater than Plain line means trend is safe, though not as safe as previous one.
- Getting lower than Plain line should act as stop loss in most cases.
- Getting lower than Deep red line means a reversal in trend.
Looking ahead.=>
Targets measured from 4th wave low were
3005-3010. this was achieved today itself.
Next comes 3055-3060.
More targets can open up. Would ponder on that when we have reached 3060 zone.
Stop loss as shown in Plain red line is placed at 2960.
We would move this up when nifty moves greater than 3010 and place it at the dotted red line.
We should move stop loss up as we move up.
additional notes.
Nifty 500 doesnot shows the same power as Nifty50. Many a times nifty500 lags nifty50.
Even then watch the red line in nifty 500 charts and cracking under it would mean -ve changes.
In longer time frames I am Bearish on NSEBank and CNIT.
I go wrong if CNIT makes new highs and remains there for 1-2 days.
Image for NSEBank is pasted under.