Todays move was unexpectedly fast even during the initial waves of the new upmove. Though the uptrend was in mind the speed was furious in morning and that too after the opening dump.
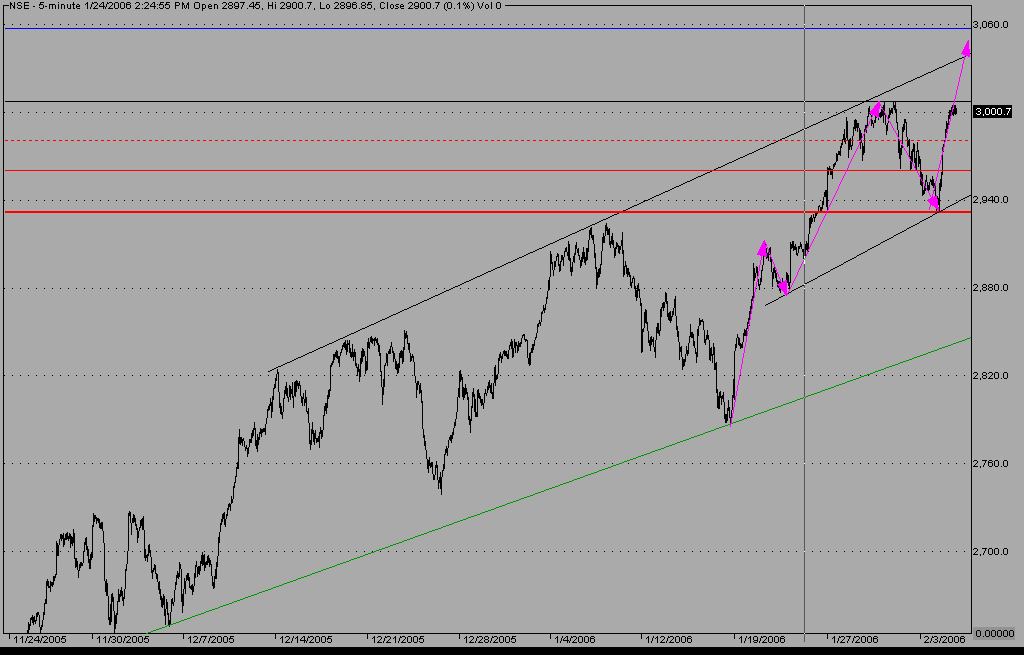
In th previous post we had made 3 red lines. (dotted at 2960 , plain at 2930 and deep red at 2915)
The lines have same meaning as usual. To repeat once again.
- Remaining greater than Dotted means trend is safe. Nothing to think of.
- Getting lower than Dotted and greater than Plain line means trend is safe, though not as safe as previous one.
- Getting lower than Plain line should act as stop loss in most cases.
- Getting lower than Deep red line means a reversal in trend.
Looking ahead.=>
Targets measured from 4th wave low were
3005-3010. this was achieved today itself.
Next comes 3055-3060.
More targets can open up. Would ponder on that when we have reached 3060 zone.
Stop loss as shown in Plain red line is placed at 2960.
We would move this up when nifty moves greater than 3010 and place it at the dotted red line.
We should move stop loss up as we move up.
additional notes.
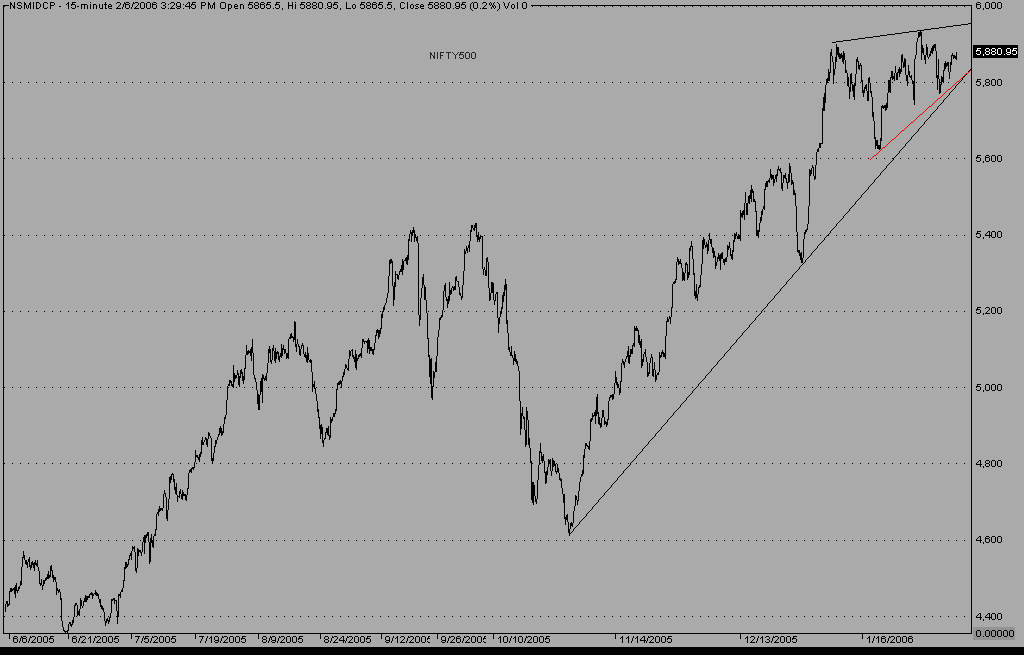
Nifty 500 doesnot shows the same power as Nifty50. Many a times nifty500 lags nifty50.
Even then watch the red line in nifty 500 charts and cracking under it would mean -ve changes.
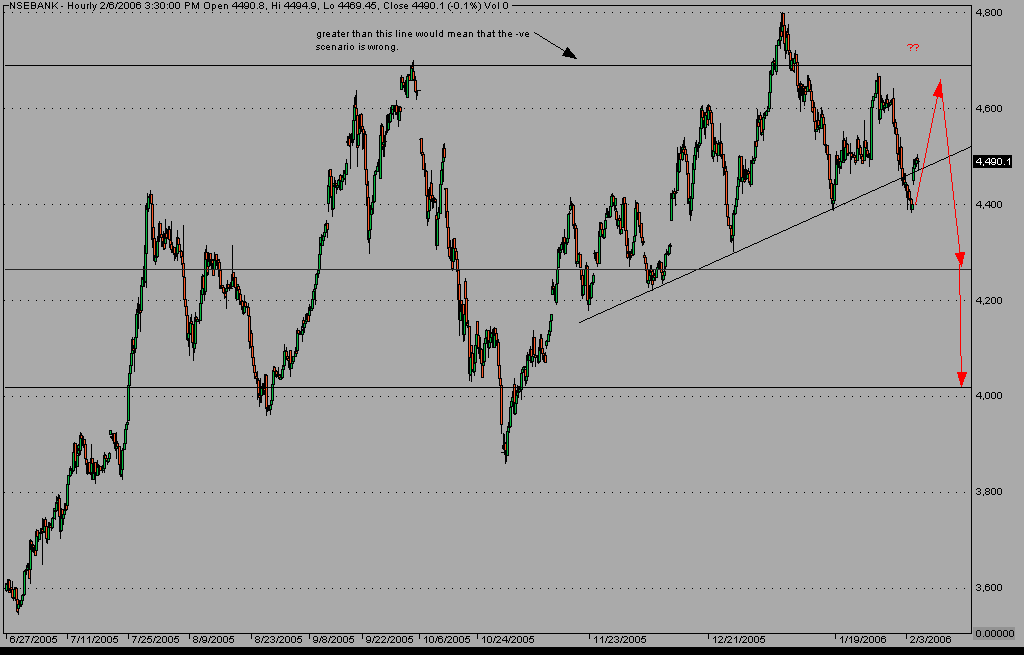
In longer time frames I am Bearish on NSEBank and CNIT.
I go wrong if CNIT makes new highs and remains there for 1-2 days.
Image for NSEBank is pasted under.
No comments:
Post a Comment