
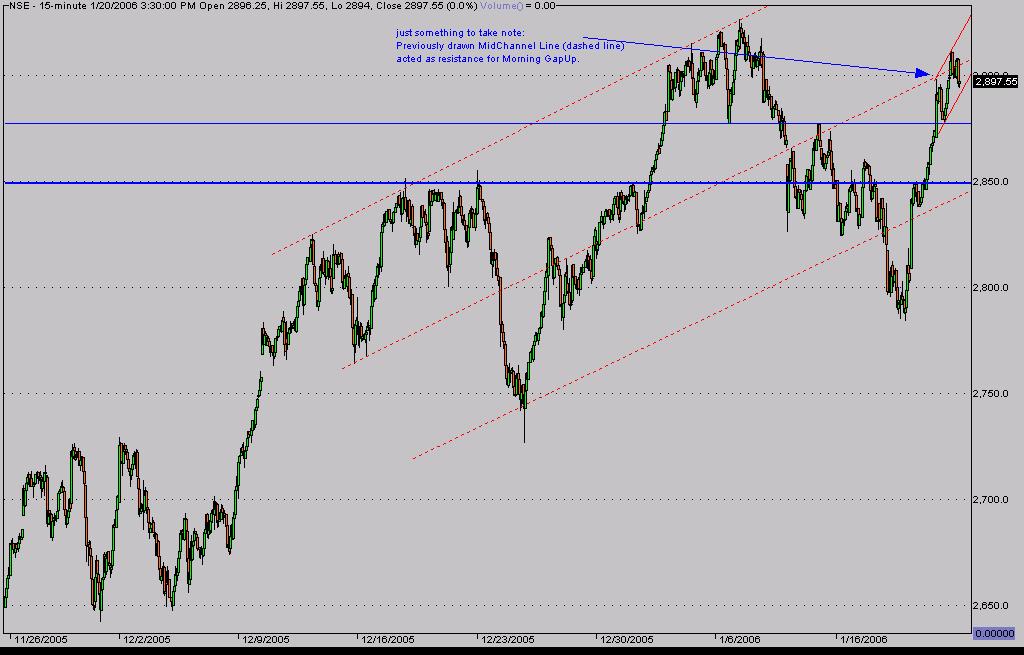
NSE again gapped up in morning to attain the 2895 target (reached 2898, see previous post) and spent the rest of day consolidating and making corrective patterns. After the gapup opening NSE again made a new intraday high, I consider this high as part of the corrective pattern.
The uptrend in nifty remains intact till Nifty> 2850 or 2860 and more so over 2880. Marked in Thick and Normal Blue lines.
Nifty Falling under 2850 would invalidate this impulsive count and nifty under 2800 would act as crack of the neck-line of a large head and shoulder pattern, which would lead to a lot of fall. This are things to keep in mind... for the just-in-case scenario.
The speed of the move is very fast and I am inclined to treat this as a new impulse which has started on upside.
There are two counts which I have in mind for nifty up move from 2785.
Count 1: from 2785 we have seen waves 12345 and todays moves were expanded flat ABC in which B made a new high and C was the fall towards the end. After this dip a new set of moves should start again in up direction.
Count 2: From 2785 we have seen waves 123 and now wave 4 is going on and was an expanded flat and Wave 5 up is left for this one set of impulse to get over.
Thus in Both the counts we have more upside in coming days.
Prices can play a lot of games with mere mortals like me and at any given point of time lot of alternate future outcomes exist. The work in trading is to play the most likely outcome while remaining aware and protecting oneself when the expected outcomes doesnot turns up.
While we have a nice uptrend here, now the work is to find evidence which could spoil the uptrend and to remain careful of it.
One such thing is NSEBANK. (image attached)
While other dominant index like CNXIT has shown the same power and wave structure as NSE Index, NSEBANK has lagged. The previous fall was very deep and has not een retraced much on upside. Pleas keep this index in view and remain careful against any sell off. While it is true that all sector indices wont move up equally fast at the same time, we should not see dramatic drops also.
A friend feels SBI is making a triangle and is soon going to make a long BreakOut. See the chart here. Doc Amar Chart.
Falling under 880 would in-validate this Bull case in SBIN, else he got it right.
have a view? Please leave ur comments.
No comments:
Post a Comment