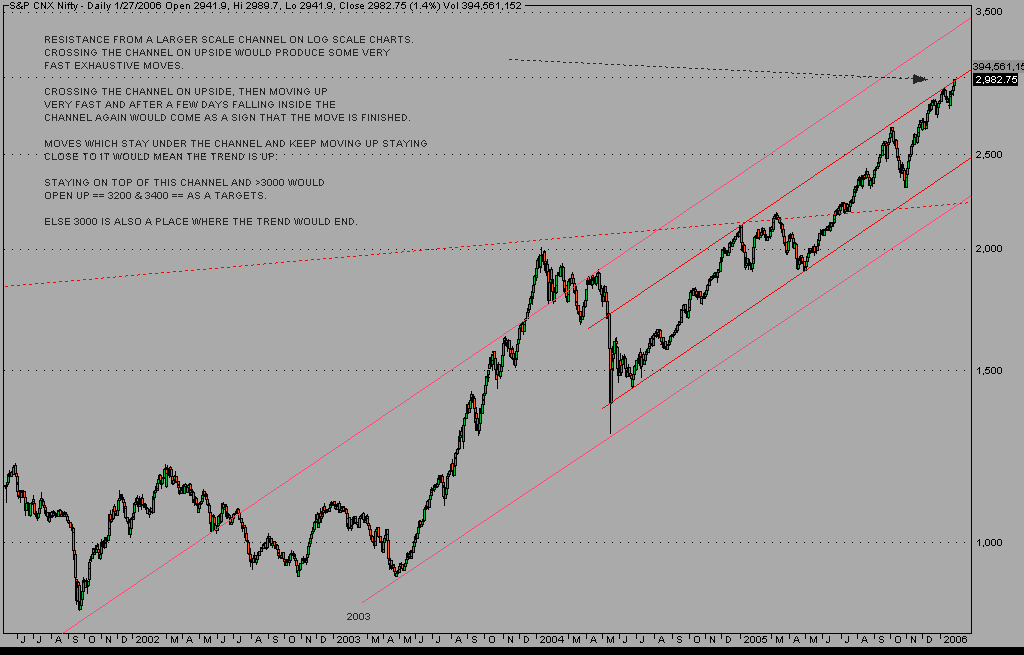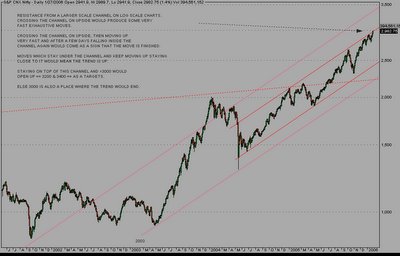

This images try to look at larger time frames, to look at the larger picture.
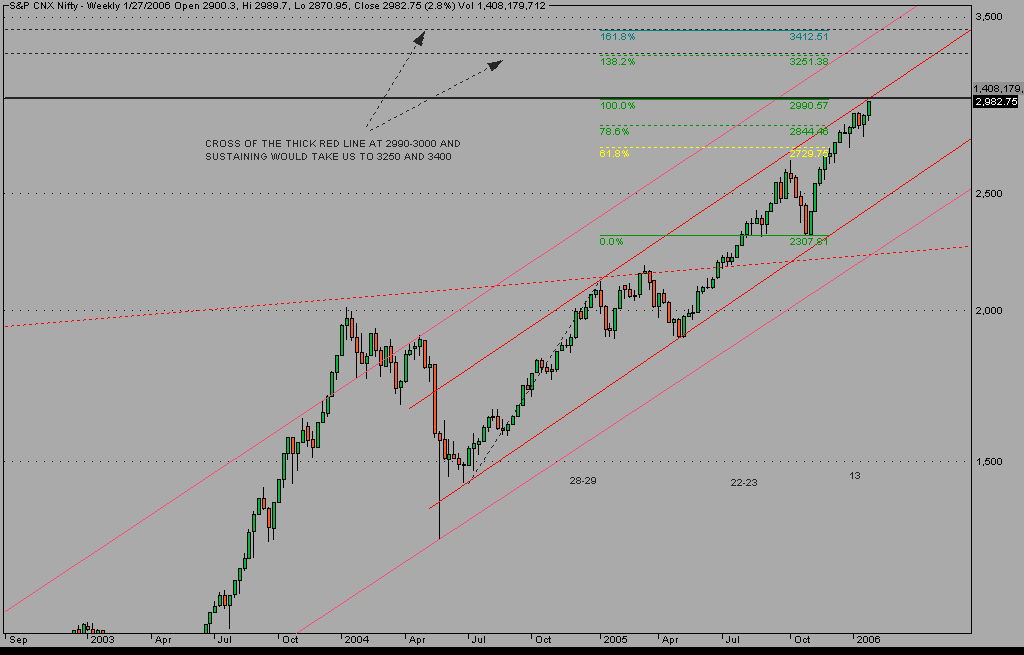
If NSE sustains over 3000 (ignore intraday moves) we can get 3250 and 3400 as our targets.
3000 would act as stiff resistance and this scenario opens ONLY when 3000 is convincly taken out. 2985-3000 was an important target zone (as posted in previous analysis) and also channel top zone as seen in the current images.
I would exit a majority of my long term investments if 3400 is seen.
Note: This is just my view and not an advice to you in any sense.
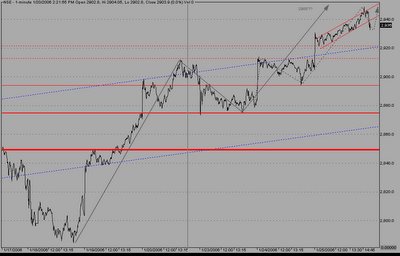
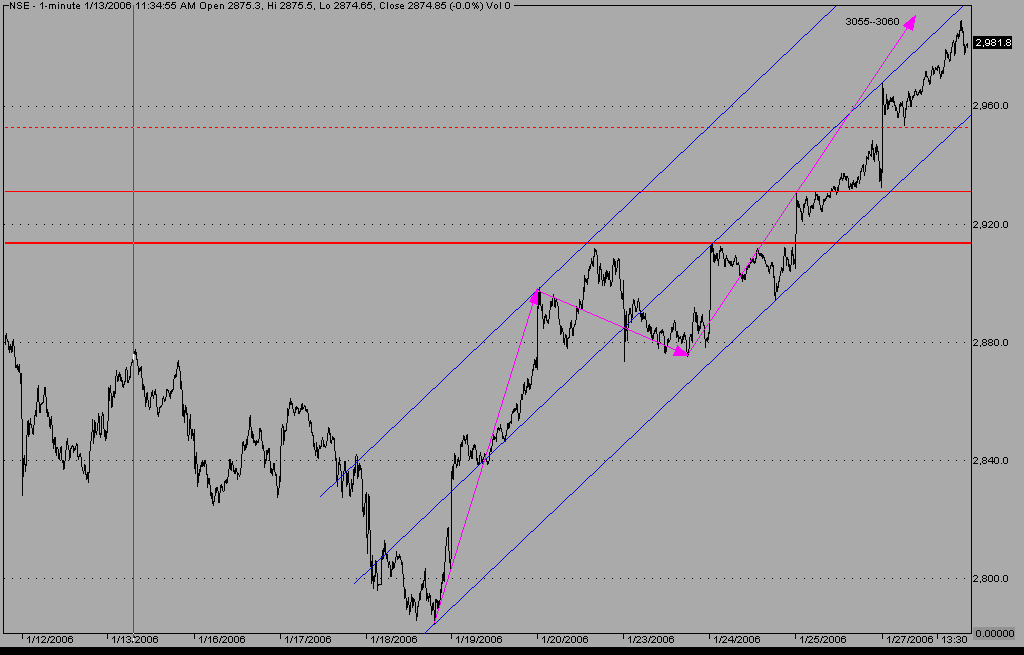
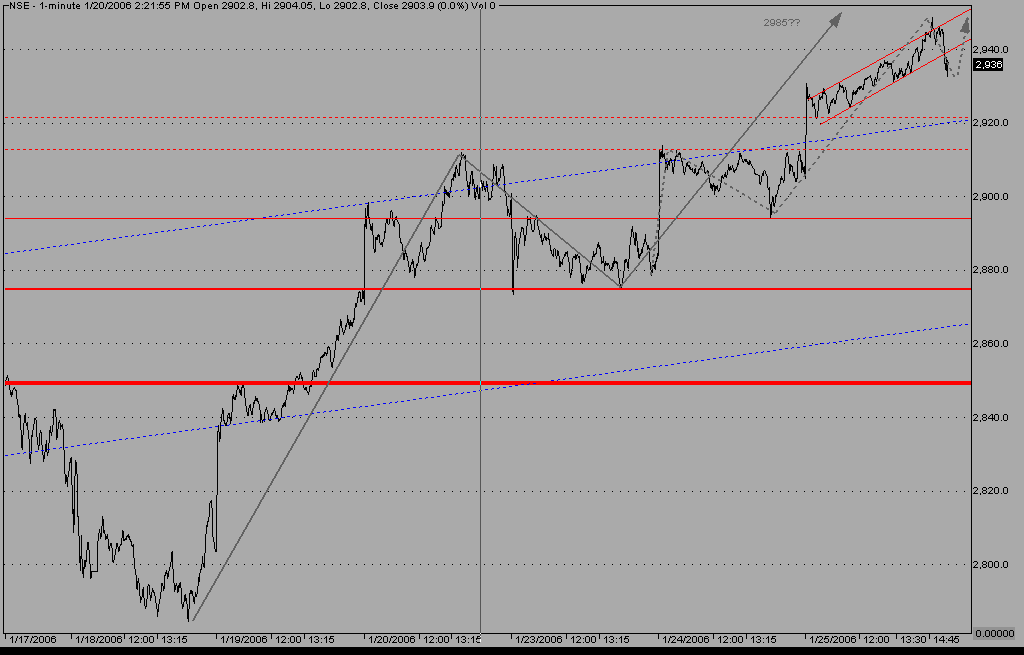
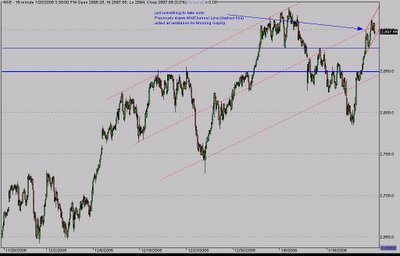
In nse we were waiting for cross of 2912 which again happened with a gap.
The first target I had was 2943 which was exceeded intraday
2985 is next. (more targets can open up).
2920-2925 which was earlier peak should provide support now while nifty tries to achive higher targets.
Under 2920 we have 2912 as support.
Falling under 2875 would mean serious damage to up trend.
If nse is really powerful we would not crack even the first support.
In the last 5 trading sessions we had
4 up gaps
1 down gaps.
The dump in Nifty in last 15 mins would have jittered a lot of traders. This is normal month end derivative settlement drama. Look at sensex, it was relatively calm. Donot read too much into the fluctuation of nse during that time.
Earlier we discussed ONGC could go to 1350. Today it went close to 1300.
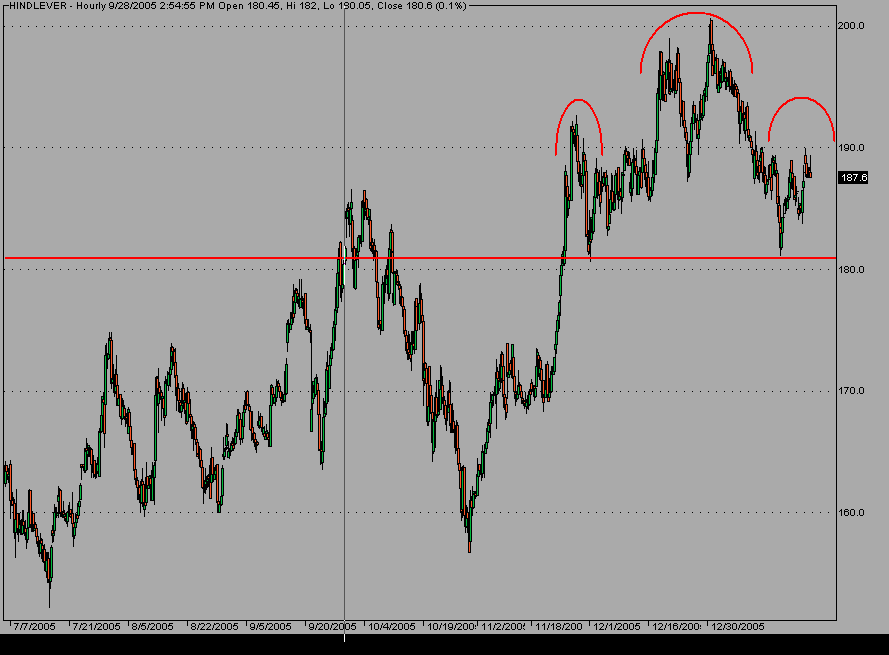
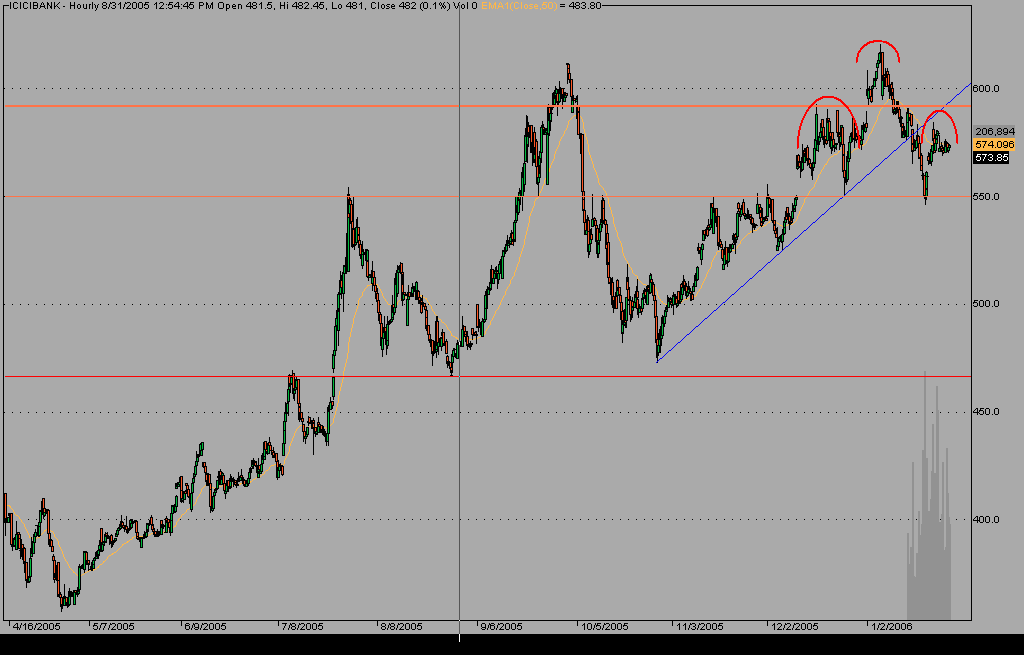
The danger HS formations in HLL and ICICI got some relief. We can rule them out even now.
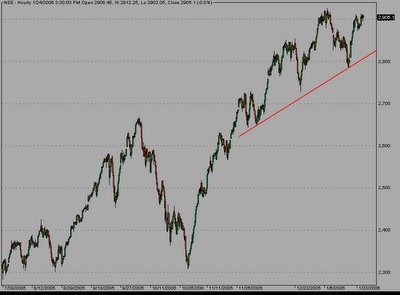 Two images are attached showing small and large time frames.
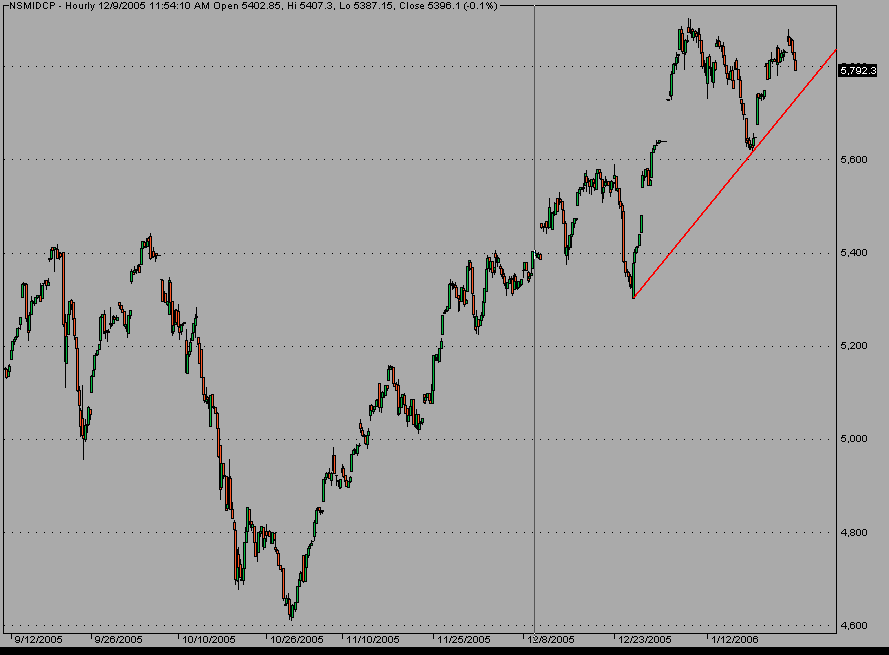
In this larger time frame image the red line joins the higher lows and if a lower low is made which violates it we know we have a change in trend. This is not to forget the forest when playing with trees.
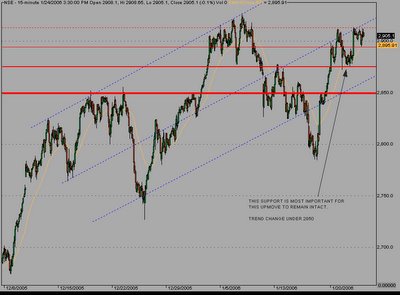
For the shorter term analysis. Nothing much changed and we are still stuck in the corrective zone.
For Nifty sustaining > 2880 was a +ve. I came down and tested it. (went to 2875).
In the new image you can see series of red horizontal lines.
The thicker the line more resistive it is.
Under 2850 we got a change in trend.
If we remain >2875 we have a more strong trend.
Craking up through the upside resistance would take nifty to 2943 and next to 2985.
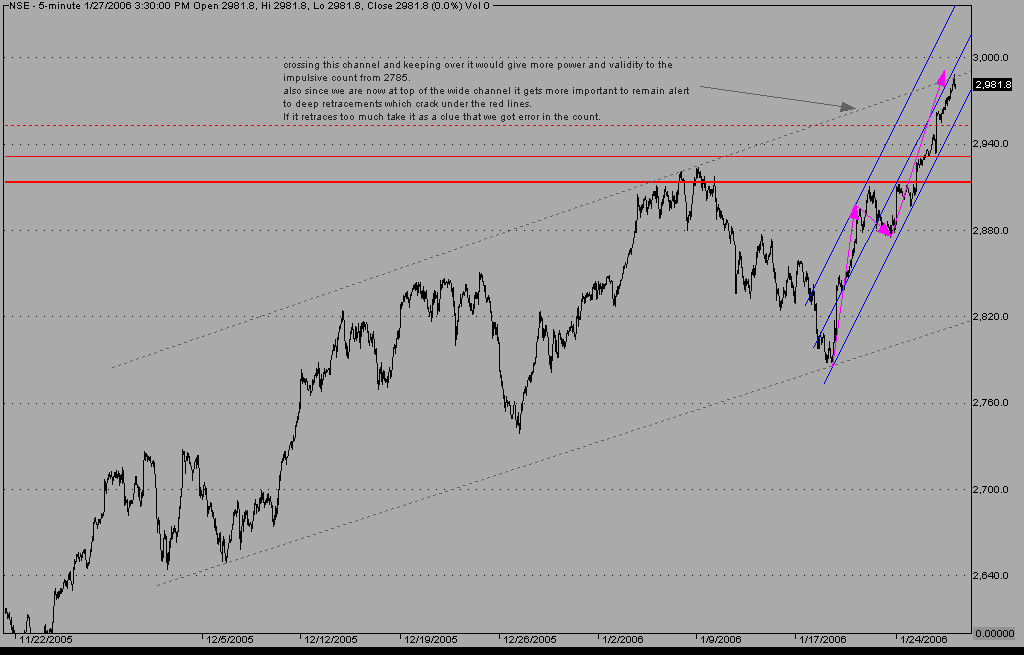
The corrective wave structure is not very clear now, as imp resistance zone attracts a lot of selling and it gets more difficult to give names to the corrective waves. We dont need to get very accurate with this to trade right. We can see nifty raising in step like fashion and and as long it keeps doing this longs are more favoured.
In the next post some charts are also attached in which crack of red line to downside would open up significant downsides. All are heavy weights, do keep them on ur radar to gauge the strength.
Got a view? Do write a comment.
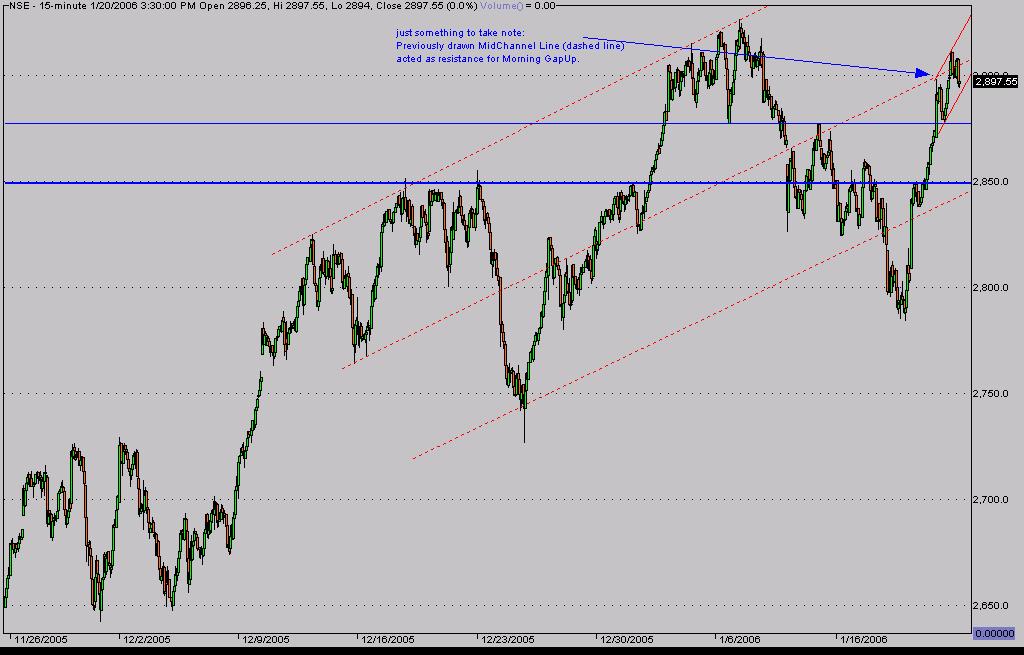
NSE again gapped up in morning to attain the 2895 target (reached 2898, see previous post) and spent the rest of day consolidating and making corrective patterns. After the gapup opening NSE again made a new intraday high, I consider this high as part of the corrective pattern.
The uptrend in nifty remains intact till Nifty> 2850 or 2860 and more so over 2880. Marked in Thick and Normal Blue lines.
Nifty Falling under 2850 would invalidate this impulsive count and nifty under 2800 would act as crack of the neck-line of a large head and shoulder pattern, which would lead to a lot of fall. This are things to keep in mind... for the just-in-case scenario.
The speed of the move is very fast and I am inclined to treat this as a new impulse which has started on upside.
There are two counts which I have in mind for nifty up move from 2785.
Count 1: from 2785 we have seen waves 12345 and todays moves were expanded flat ABC in which B made a new high and C was the fall towards the end. After this dip a new set of moves should start again in up direction.
Count 2: From 2785 we have seen waves 123 and now wave 4 is going on and was an expanded flat and Wave 5 up is left for this one set of impulse to get over.
Thus in Both the counts we have more upside in coming days.
Prices can play a lot of games with mere mortals like me and at any given point of time lot of alternate future outcomes exist. The work in trading is to play the most likely outcome while remaining aware and protecting oneself when the expected outcomes doesnot turns up.
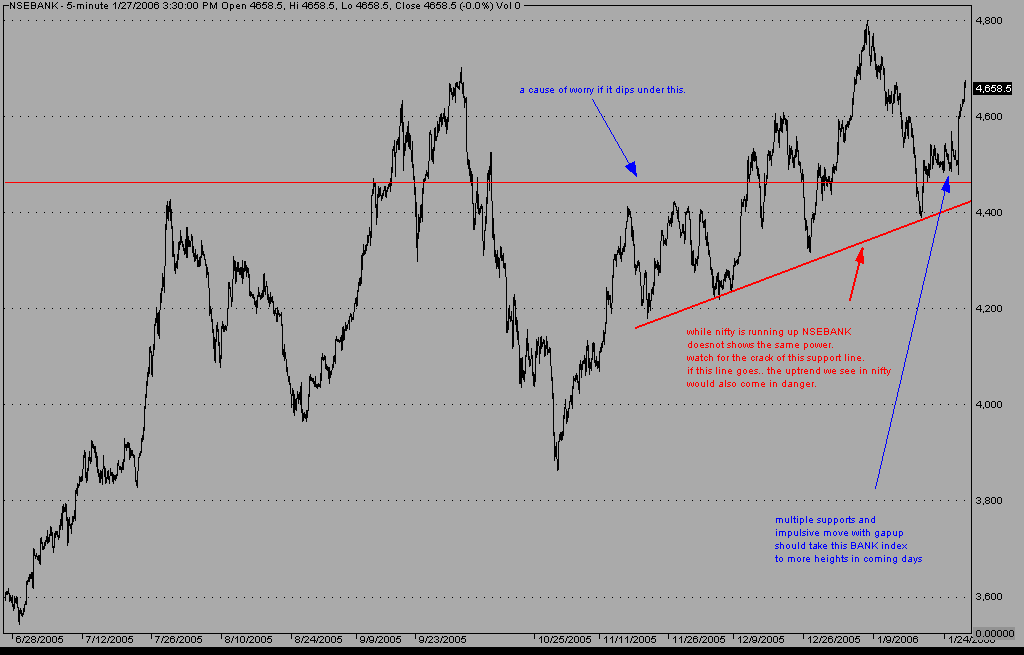
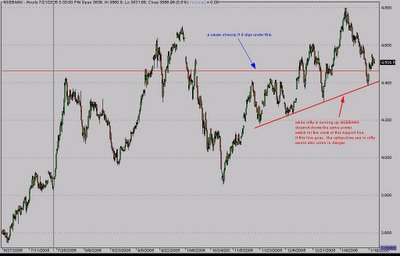
While we have a nice uptrend here, now the work is to find evidence which could spoil the uptrend and to remain careful of it.
One such thing is NSEBANK. (image attached)
While other dominant index like CNXIT has shown the same power and wave structure as NSE Index, NSEBANK has lagged. The previous fall was very deep and has not een retraced much on upside. Pleas keep this index in view and remain careful against any sell off. While it is true that all sector indices wont move up equally fast at the same time, we should not see dramatic drops also.
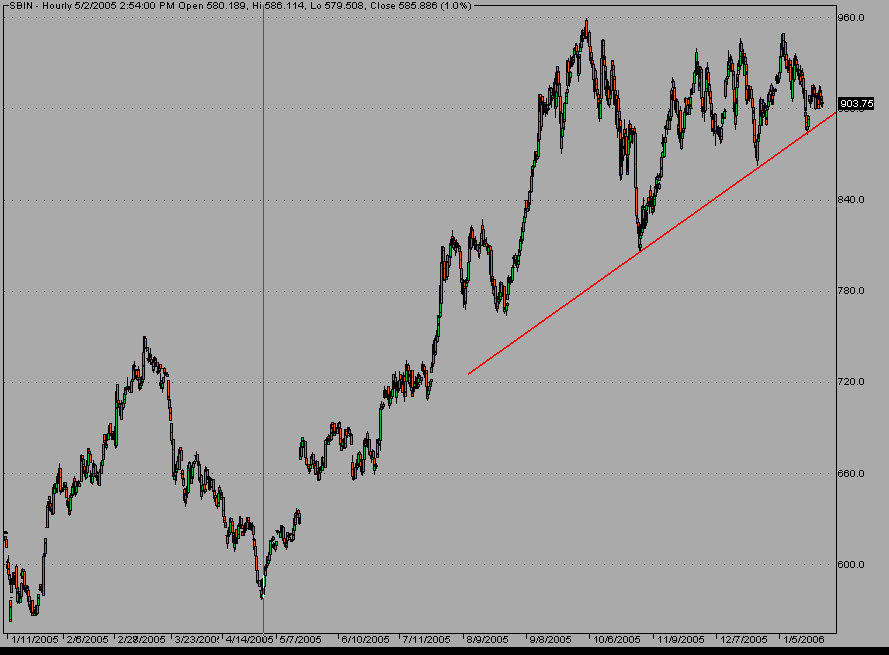
A friend feels SBI is making a triangle and is soon going to make a long BreakOut. See the chart here. Doc Amar Chart.
Falling under 880 would in-validate this Bull case in SBIN, else he got it right.
have a view? Please leave ur comments.
 Nifty 19-10-2006
Gapped up through 2830. (oh man)
The corrective view is out of window.!!
Took a little while to digest the move and imagine the implications.
Should have taken yesterdays fast vertical rise earlier to close more seriously.
This points us to an import clue in trading. Speed of moves.
A very important things which goes un-noticed very often.
As was mentioned in eariler post Nifty >2830 puts an end to correction.
Getting long as soon as the moves slowed down and retraced in earlier parts
of the day was a low risk trade setup.
Expect much more in nifty in coming days.
We have a 5 legged rise from 2785.
Wave 3 = 1.6 * Wave 1 and Wave 5 = Wave 1 till now.
Wave 5 can still extend and reach to 2895 to make it to 1.6 times wave 1.
Though thats not something you should trade as it gives a poor risk profile.
So whats the action plan.
Wait patiently for this upmove to slow down and show some retracement.
Look at 23.6% and 38.2% retracement of this move and that would give a good area to take longs.
This move went from 2785 to 2875 today. thats 90 pts.
Next upwave would atleast do 90 or more points.
Expect 2 more such powerful up waves.which can easily take
index greater than 3000 which is the longer term targets.
Get long on retraces.
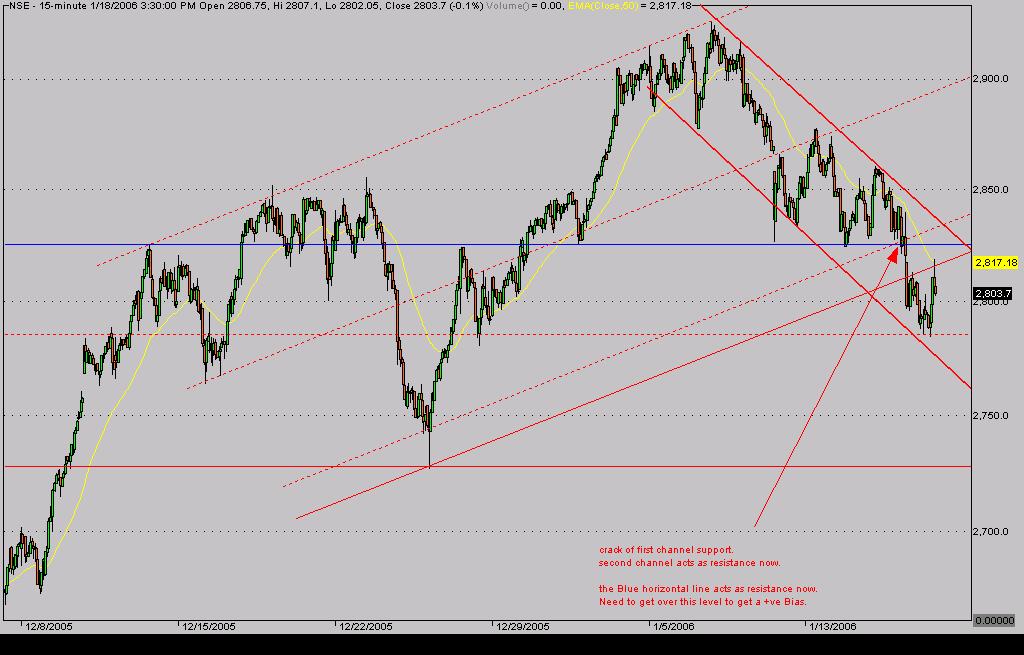
Nifty 18-01-2006. after the morning crack nifty took good support at 2785 region.
(click on image to enlarge)
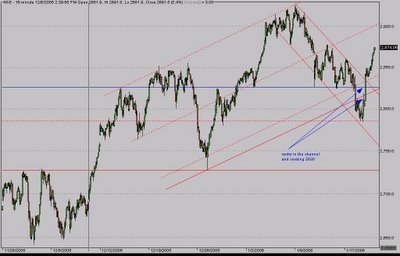
We have a clear down channel in place and todays low could just act as an intermitent halt in the larger down move t0 2720.
2830 region (Blue line) would act as strong resistance to any upmove & Nifty>2830 would mean the correction is over.
Someone who was aware of the channel could have used the channel crack to to short in early trades.(look at the earlier post)
Crack of 2785 would again open lower targets for nifty.
Use the channels and resistances as your guide.....
Larger trend remain Up till 2720.
Thought of the day.
"The more you understand the concept you are trading, how it might behave under all sorts of market conditions, the less historical testing you need to do." Tom Basso
======================================================
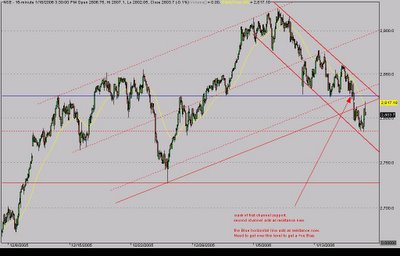
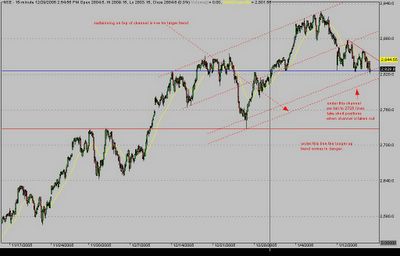 2820 is channel support. 2800 also comes as an important channel support and pyschological levels. For me 2800 is the target for this correction. under 2800 we go direct to 2720. NSE falling under 2720 would destory longer term uptrend.