Tuesday, March 28, 2006

>NSE 28-03-2006

Previous post on Nifty was made at >NSE 03-03-2006
Nifty was at 3143 at that time.
Target of 3250 is achieved and next 3400 is pending.

3400 would act a huge top and I would sell most of my left over portfolio there.
(my view can go wrong, act on your own risk)

We also have a nice channel in Nifty and one should trail the flow.


for itc channel tarding image click here
to get Intraday Data for Live Trading Visit >>EagleEye Data System

Saturday, March 18, 2006

>Some Articles on Trading

An important concept that will definitely reinforce your trading is that of swing points.
What are they? Well, stocks as you very well know will not go up or down in a straight line; in fact they retrace (in essence turn around) for their next move, be it up or down.
>>>Recognize Swing Points and Become a Better Trader

An important aspect of technical analysis that most traders miss is the big difference between
linear and log scale on charts. Sound like math mumbo-jumbo?
>>>Landon Swan explains Linear vs Log charts

Making quick, smart decisions is a critical part of the equation when it comes to being a successful day trader.
>>>Proper Nutrition for a Trader Makes Good Sense

Friday, March 17, 2006

>The Power Of MACD Divergence Trading

Here is an example of Alert Strategy which is an "Art" of looking for MACD Divergences.
Divergence is one the primary things I remain on the look out for.
Again nothing works always, so that is the caution to keep in mind.

(open image in new window to look at the details)


As an exercise for you, Try Locating positive divergence on Charts of RANBAXY. Which makes it a good purchase now that it is at 400 which is an important support level. Keep a stop loss at 390 and target 40-50 rs upmove in it.

Thursday, March 16, 2006

>A few thoughts on Trading

Day Trading Vs Informed Trading.

Often people ask how they can minize losses in trading.
=> The simple answer is to understand why looses happen. ( think more on this)

Which is more powerful Day Trading or Swing Trading.
=> Knowing the reason to put a trade is the source of power. The reason includes the time frame also.

Will softwares like AdvancedGet or MetaStocks Exploration Or Ami Scans help me make profits?
=> You make profits when you understand what you do and get more efficient at it. If you use software as your slave and make them do what you want, its an intelligent process.
If you make Sofwtare your master and depend on them for your decisions, most likely the future would turn sour.

How can one turn into a trader who makes more profits?
=> The easiest way is to read, read, read and think.
Define your skills and risk taking capacity.
For example: People who cannot sustain huge swings (+ or -) in portfolio should restrain to cash stock trading.
I would emphaise the reading part. Read as much as you can. Reading would lead to thinking and thinking helps in looking at all sides of a coin, which makes for productive use.

What has Risk Management got to do with Trading?
I have very often emphasised on appreciating and calculating risk and keeping risk at the core of ones trading. When risk calculations are kept aside and one goes "hot headed" in the trading hole the results are orgasmic. (very rarely pleasant and most often its a painful ordeal)
What does risk calculation means?
It can come down to as easy as finding how much money to put in each trade, setting a maximum loss for each trade and the most important of all knowing WHY the trade is taken.
Knowing this WHY helps in getting out of a trade also.
People who enter trade WITHOUT any well defined (thought)reason very often get stuck.

Just like 007 James bond, always keep in mind the reason for entering a trade and when to quit and keep the exit options ready..

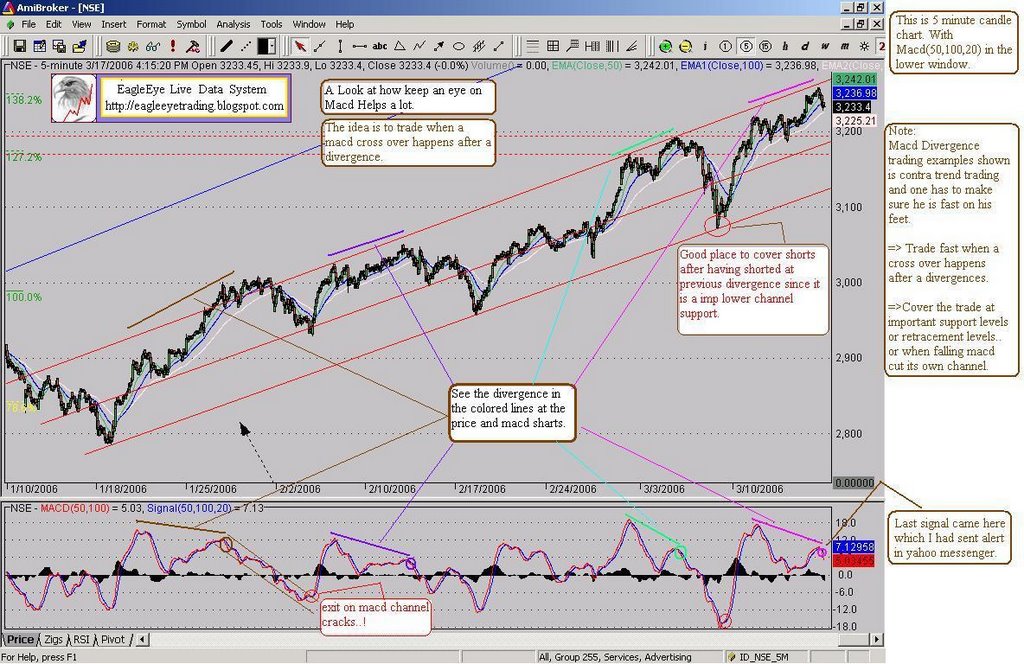
Does using sophisticated systems and High Speed Data helps make more profits.
=> The reason and time frame for your trading should dictate the complexity of your systems and data speed.
A person who trades once in 6 months and holds positions for a long time would not need realtime 1 min OHLCV data.
A person who trades 2 times a day or once in 2 days would make more profits having a speedy system which helps and alerts him in making faster decisions.
(even then keep the computer as a slave and not as a master)

Friday, March 10, 2006

>Some interesting Technical Analysis Pages

Hello

Visit the few pages linked under.
  1. Purpose is just to see and explore the thouhts of many people.
  2. See the systems they use.
  3. ask yourself the why part
  4. to compare you views/analysis/notes with them.
  5. to know more and keep the mind stimutaled.

~~~~~ Brain Food ~~~~~ Does Elliott Waves and stuff.

Market Analysis and Technical Setups more into Traditional Technical Patterns

//////// TREND CHANNEL MAGIC/////// Successfully uses the very-simple concept of price trend and channel to make good trading decisions.

FIBONACCI FORECASTER This one whose mails and ideas i sent to group is quite well known and has nice ideas. Focuses on Elliott Waves and Time Cycles.

http://yelnick.typepad.com/ A Good place to remain updated on Many things technical. A good place to read sometime to have a wider view.

Thats all for now.
If you have interesting links please post them in comments to this post.
Cheers.!

Monday, March 06, 2006

>Sensex Yearly View.(alert for long term holders)

Open chart in new window to look into details.

A few points which u need to keep in mind while looking at long term technicals.
1. Tehnical analysis is a pathetic tool when it comes to long term. (with this read the rest !)
2. Long term fries, grills and toasts most techno-anal-yeast.. haha

For the serious ideas.
1. there is a very good chance a long term top happening soon.
2. the waves are gelling and yelling for this.
3. approximately some where after 1 year or so should create a good purchase area.
4. do serious profit-taking when index hits the top levels shown. I think the chances that you repent this multi-year profit taking is very less.
5. this view can fail and you cant sue me that.! use at ur own risk.

Friday, March 03, 2006

>NSE 03-03-2006

Open image in new window to enlarge.


A little comment:
Have heard a lot of people saying..
"Just short the index." I would say its dangerous to do it right now expecially if you cant place a strict stop loss and are not very fast on ur feet.


------
Use Live data for ur trading.
Welcome to the EagleEye'd World.!

http://eagleeyetrading.blogspot.com
http://finance.groups.yahoo.com/group/EagleEyeTrading
=========================================

Thursday, March 02, 2006

>State bank of India.. A technical Look into Future

Older view was posted on 2-March-2006. Lets see what has happened 4.5 months later.
Stock went up and did the upper target of 1025.
The fell to 850 area.. went up again near to previous highs and finally collaped.
See the previous image and the projected sequence..! ;-)


======To read Older view see under-neath...=========
View Summary
Short Term.-> Expect more consolidation and purchase at lower supporting trenline of the small triangle with a small stop.
Medium term->expect to touch 1000-1025 or more.
Longer term ->Expect a large corerction after the medium term target is achieved.

Open image in new window to see larger image.


get live data for trading.!
Welcome to the EagleEye'd World.!
http://eagleeyetrading.blogspot.com
http://finance.groups.yahoo.com/group/EagleEyeTrading